
During the pre-election debate in the USA (1980) between Ronald Reagan and Jimmy Carter, the former said: “When you stand in front of the ballot box and have to make a decision, you better ask yourself: are you living better than 4 years? ago ? Do you find it easier to go shopping? Is unemployment in the country higher or lower than 4 years ago? Do you feel safer than 4 years ago? And if you answer yes to all these questions, then your choice will be very obvious!” HotNews reviewed the relevant economic figures, comparing not with the pandemic year 2020 with distorted figures, but with the previous year – 2019.
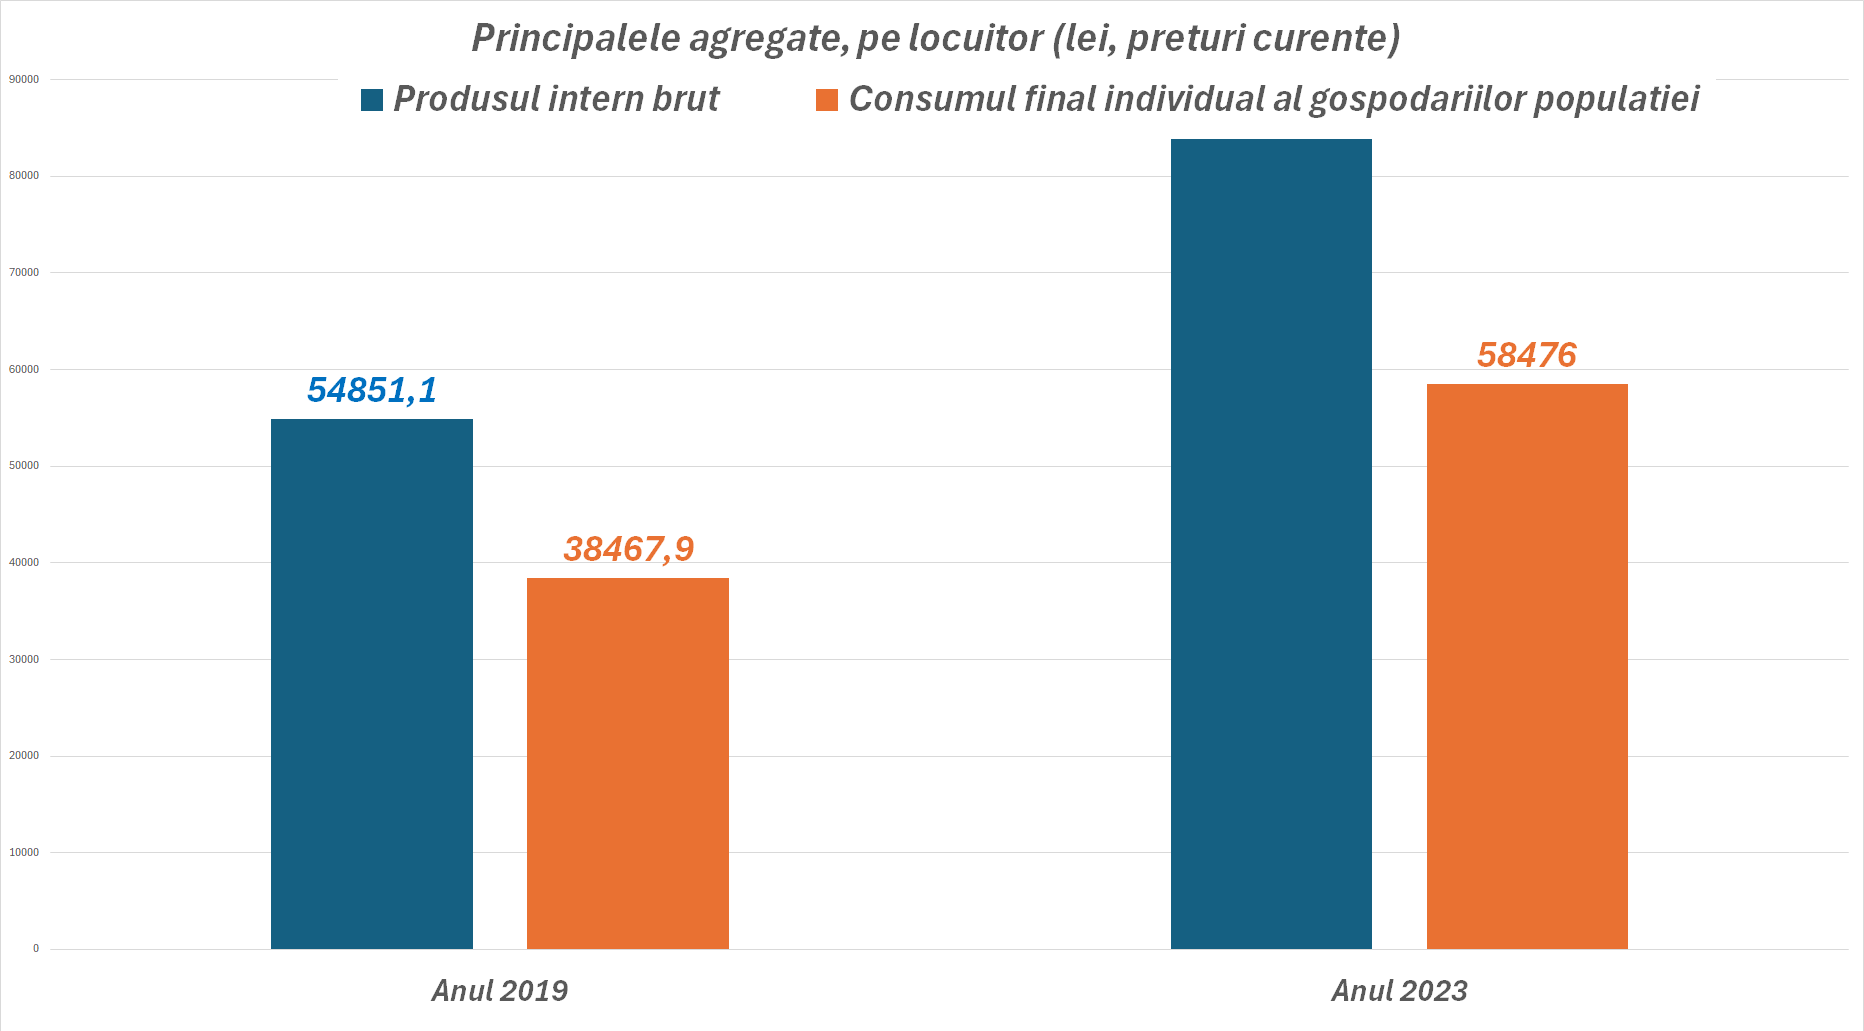
If we look at GDP per capita and individual household consumption, 2023 was a better year than 2019. GDP per capita has been steadily increasing, as has personal consumer spending.
So, in 2023, inflation was over 10%, while in 2019, inflation was 3.8%.
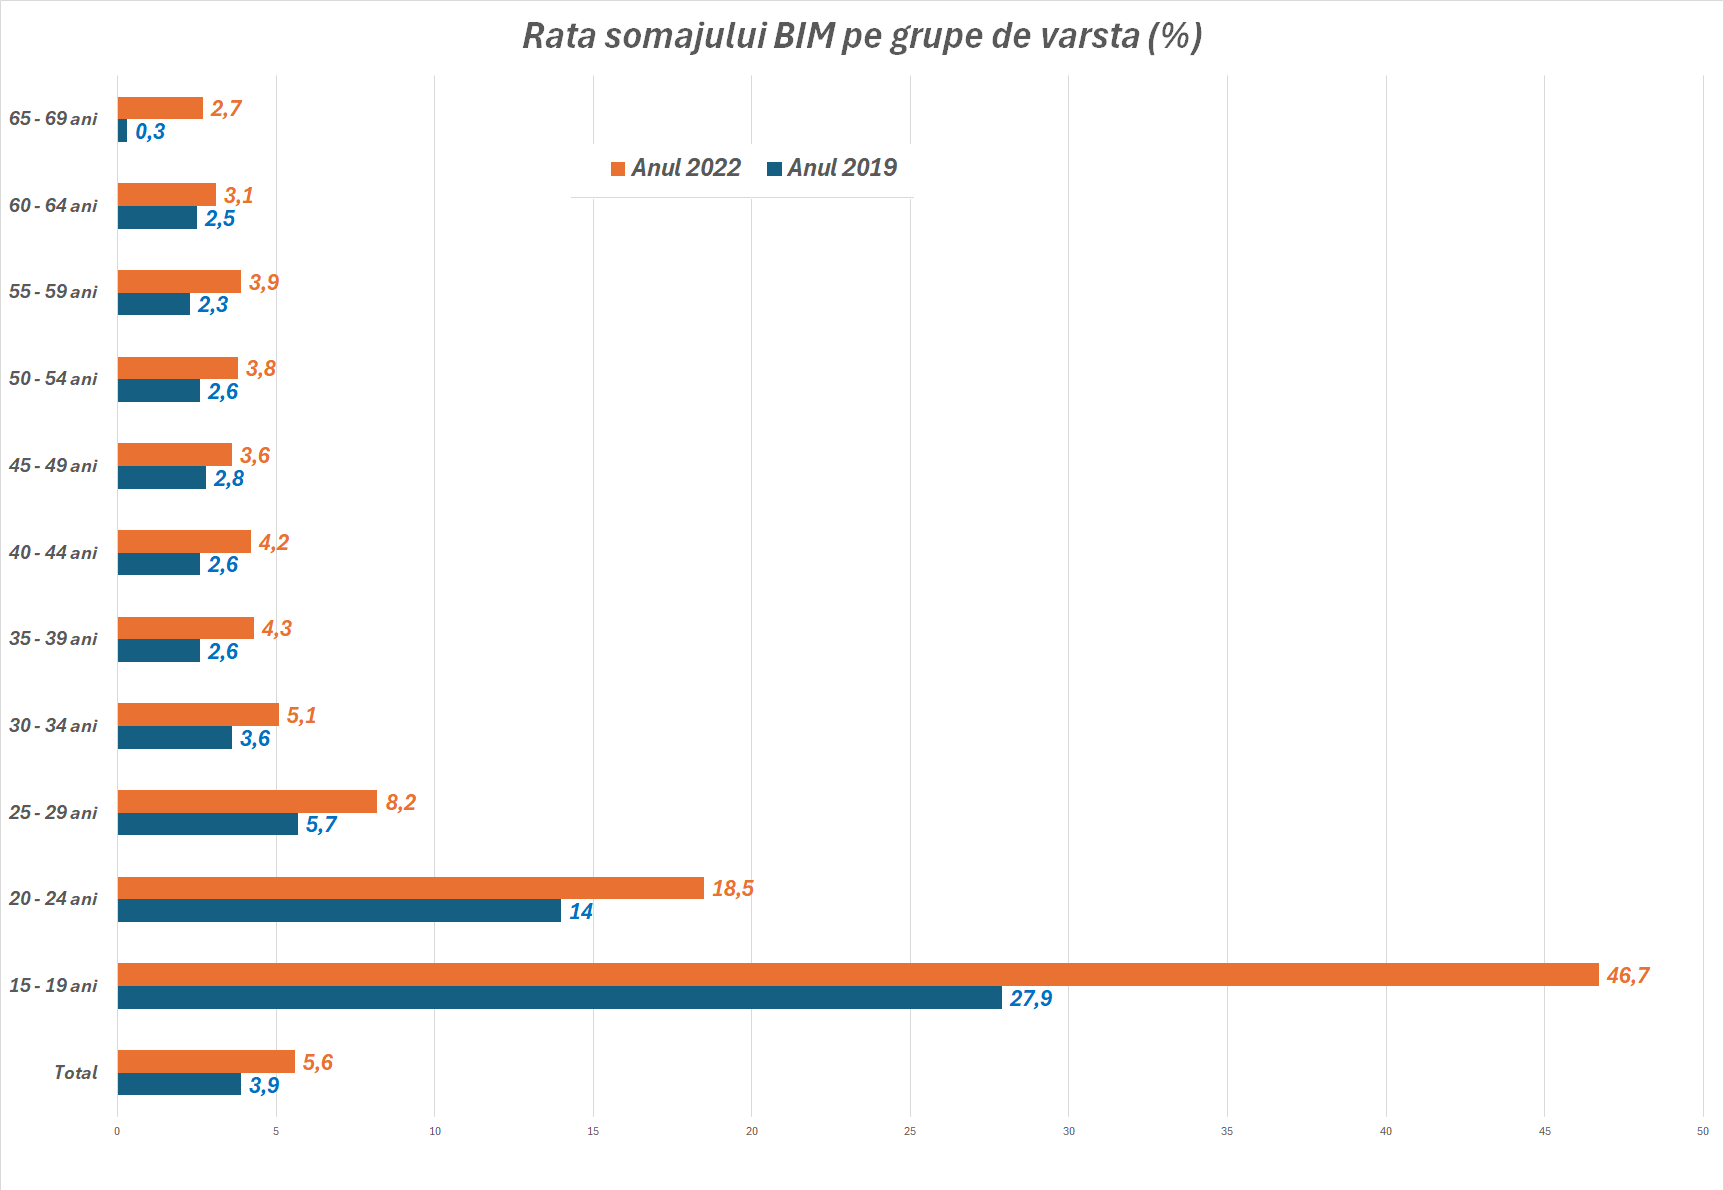
If we look at the unemployment rate as defined by the International Labor Office, we have a very different picture. Unemployment has risen, almost doubling in some age groups. The highest level of unemployment is observed among 15-19-year-olds, then 19-24-year-olds, and then 25-29-year-olds. This can signal both the difficulty of adapting young people to the labor market and the mismatch between market demand and supply.
When we compare two indicators – last year’s and 4-5 years ago, we do not want to say that one is good and the other is bad. But the fact that changing one causes other changes in the chain.
For example, the rise in prices (inflation) has led to an increase in the price of apartments. Buying a house is now more difficult.
Or the fact that unemployment is now higher may lead to higher crime rates in some countries.
For example, the crime rate increased in Mehedinka, Konstanz, Braila or Satu Mare, but decreased in Galaka, Ilfov or Bistrica-Neseud, even though it remained roughly the same at the national level.
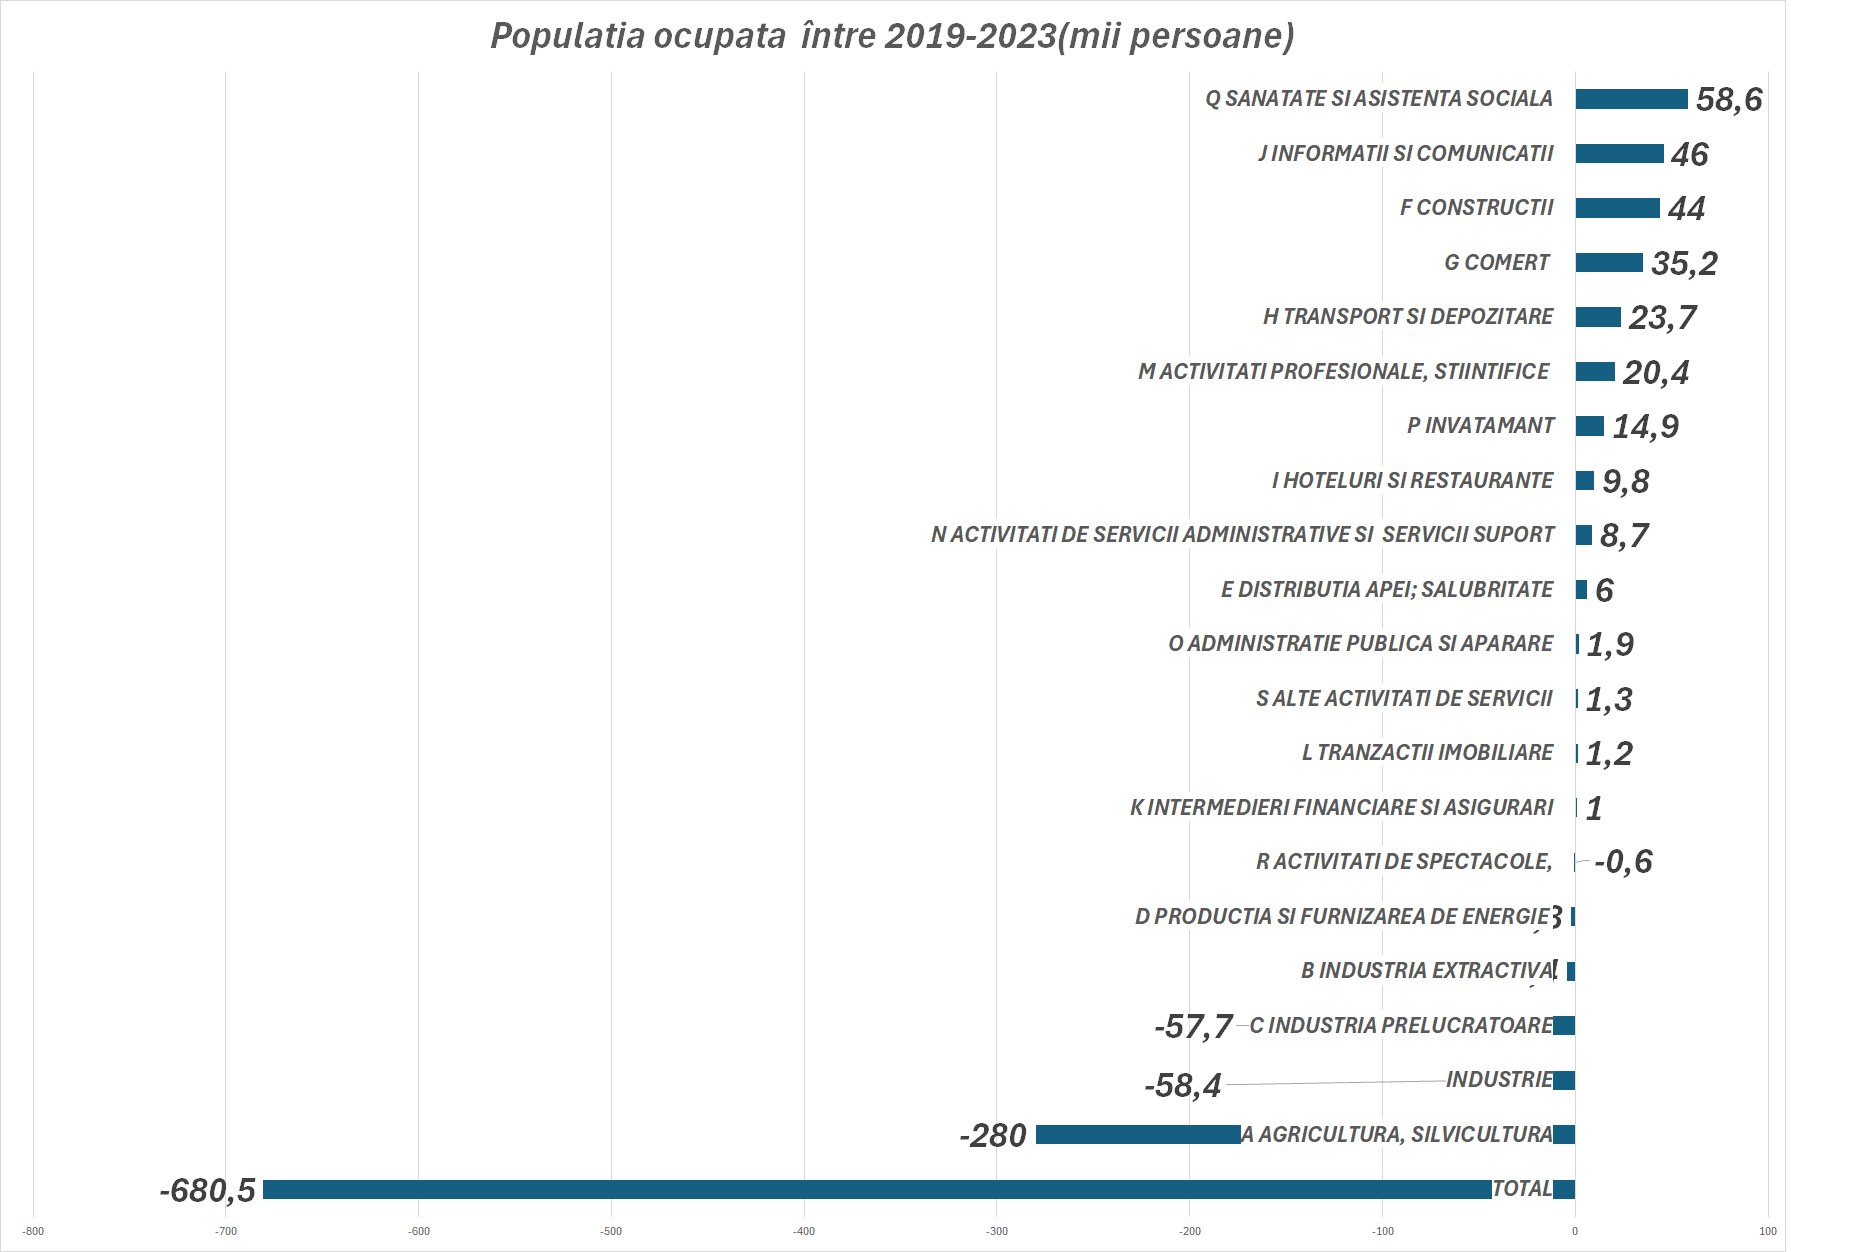
The sectors that shrank in terms of workers were agriculture, industry and manufacturing, particularly entertainment and energy producers. The rest became winners.
The situation becomes even more complicated if we go to the district level.
The richest county, which is definitely Bucharest, has more than 260% of the EU average in terms of purchasing power parity (that is, more than 2.5 times richer than the average), but at the other end of the ranking we find the poorest county, Vaslui. almost 7 times poorer than the capital.
It should be noted that although Bucharest leads in terms of GDP per capita, followed by Cluj, over the past 20 years the rate of development of Cluj residents has been much higher than that of the capital.
Covasna, Galați, Vranca and Bacău had the lowest level of development, and Cluj, Bucharest, Salai and Timișoara the highest.
Source: Hot News
Lori Barajas is an accomplished journalist, known for her insightful and thought-provoking writing on economy. She currently works as a writer at 247 news reel. With a passion for understanding the economy, Lori’s writing delves deep into the financial issues that matter most, providing readers with a unique perspective on current events.