
As much as a person spends poor household on food per month he spends one wealthy household for clothes and shoes. The transportation costs of a wealthy household account for 84% of the total monthly equivalent expenses of a very poor household. At the same time, the data show that very poor households rely only on public free education, as only 0.9% of their spending goes to the education sector, with leisure and cultural activities taking second place.
The existence of economic inequality, if nothing else, is a timeless phenomenon. However, the Household Budget Survey 2021 Income and Expenditure figures released yesterday Hellenic Statistical Office (ELSTAT) actually show that the second year of the pandemic, with its severe economic consequences and the onset of the inflationary crisis, widened the gap even further.
Thus, according to these figures, the share of average equivalent expenses (purchases, current prices) of the richest 20% of the population is 5.2 times higher than the share of average equivalent expenses of the poorest 20% (4.8 in 2020). ). Although the distance is reduced by 4.1 times when so-called implicit costs, which include goods and services that a household can receive from its own production or store, are included in consumer spending, the fact remains that it is still greater compared to the 2020 equivalent (in 3.5 times). Households in the poorest 20% of the population increased their spending compared to 2020 by 2.6%, while households in the richest 20% of the population increased by 10.7%, while the monthly equivalent expenses in the first case amounted to only 336 euros , and 1744.24 euros in the second case. It is explained here that equivalent expenses are not the exact expenses incurred by the household, but the total expenses of the household after dividing by the equivalent household size. The equivalent household size is calculated using a modified OECD scale that weights 1 for the first adult, 0.5 for the second adult and children aged 14 and over, and 0.3 for children under 14.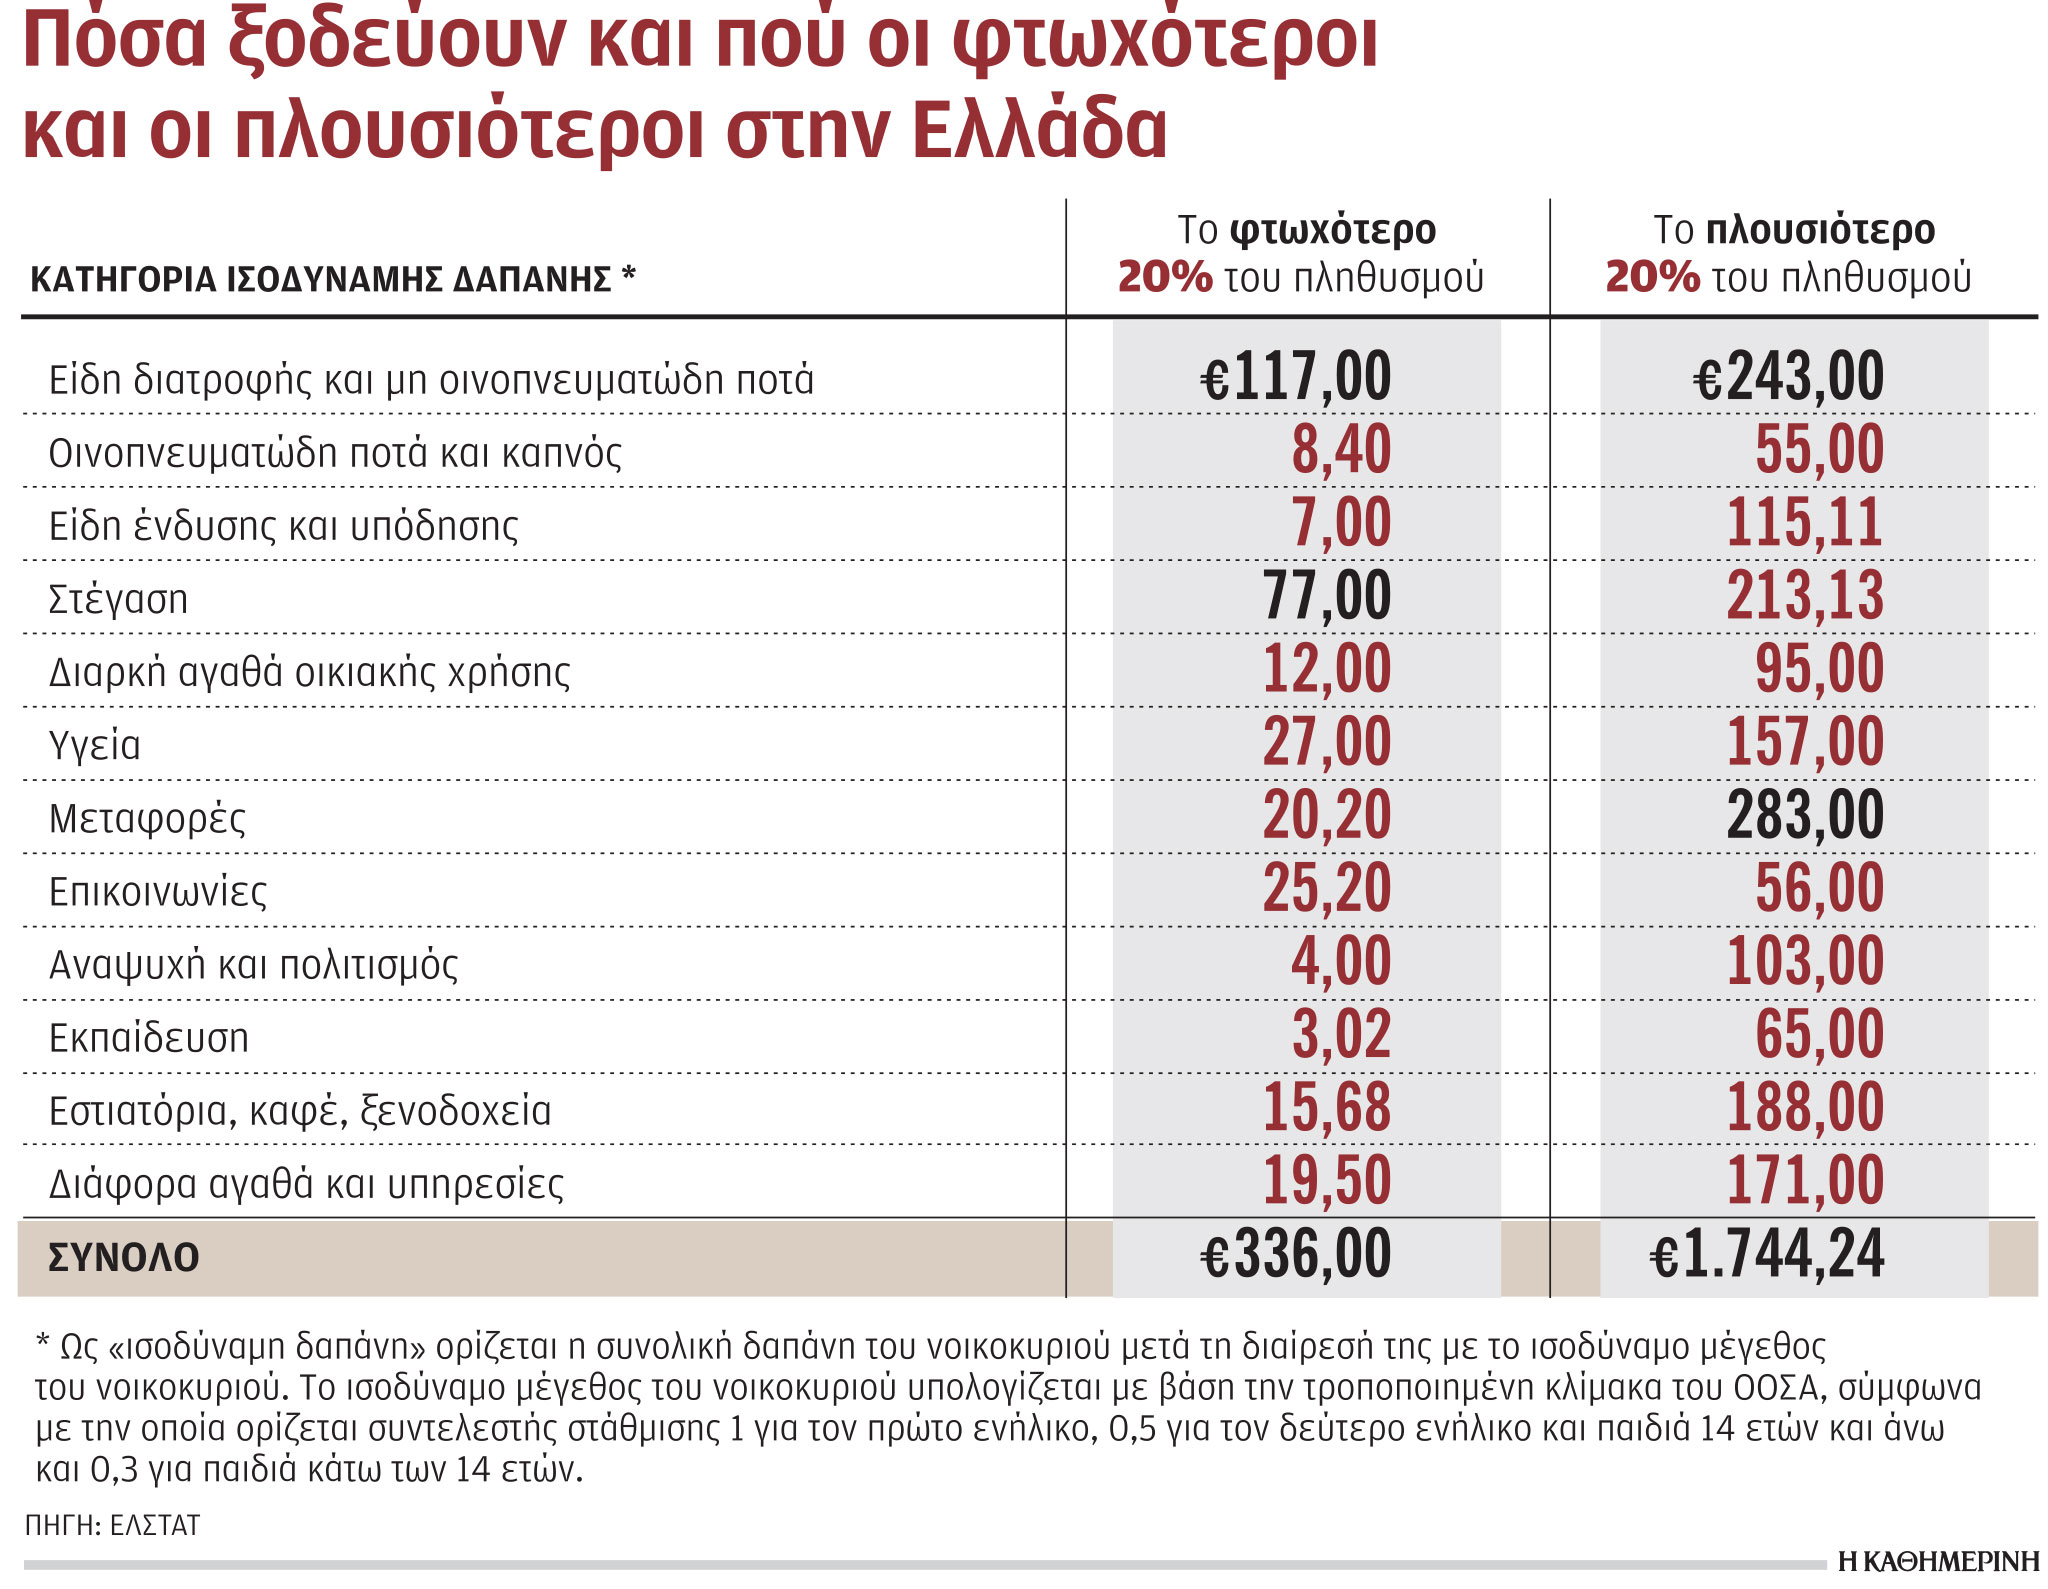
Very poor households spend more than 1/3 of their monthly budget (34.8%) on food, while the corresponding share of the richest 20% of the population is 13.9%. And in absolute terms, it may be more than double in the second case (€117 versus €243 in equivalent spending), but in reality the burden, especially from rising food prices, is much greater for poor households. The fact, for example, that food prices have risen by 13% this year, puts the economically disadvantaged sections of Greek society in the question of survival.
The proportion of the population at risk of poverty increased to 17.1% in 2021 from 15.6% in 2020.
Housing cost
And if one “headache” of low incomes is rising food prices, then the other is the cost of housing. Very poor households spend almost 23% of their budget on housing, while the corresponding figure for the richest households is only 12.2%.
Where does most of the spending of the wealthiest go? 16.2% of the monthly cost equivalent (€283) is for transport, as they often have multiple cars but also travel by air for work or pleasure, which is completely absent from the daily lives of poor households. Most of the expenses of the richest go to restaurants and hotels (10.8% of the budget versus 4.6% for the poorest). In absolute terms, the gap is much larger: 188 euros for the rich and slightly less than 16 euros for the poor.
A new phase of impoverishment, probably caused by two successive crises, a pandemic and then an inflationary one, is also evidenced by the fact that in 2021 the proportion of the population at risk of poverty increased to 17.1% in 2021 in 2020.
More generally, according to ELSTAT data, the average annual household spending on purchases in 2022 was 17,037.48 euros (1,419.79 euros per month), indicating an increase in current prices of 6.6% and in constant prices by 1 .4% in relation to 2020, an element showing the impact of revaluations that have appeared since the second half of 2021. The largest share of average household budget expenditures in current prices falls on: food and non-alcoholic beverages (22%), accommodation (14, 7%) and transport (12.7%), while the smallest share of expenditures (3.4%) falls on education services.
Source: Kathimerini
Lori Barajas is an accomplished journalist, known for her insightful and thought-provoking writing on economy. She currently works as a writer at 247 news reel. With a passion for understanding the economy, Lori’s writing delves deep into the financial issues that matter most, providing readers with a unique perspective on current events.