
Topic • Data • Mothers and children, women without children. Overview • Having and not having children • Having children. How many? • Prospective reporting of data on the number of children during the census • Literature • Add. addition
1. Subject
The National Institute of Statistics publishes annual data on the natural and migratory movement of the permanent population, which provides a statistical basis for the analysis of demographic phenomena and processes by calendar years, the important indicators after 1989 are the indicators related to the annual decrease of the permanent population. through two components, a natural decline and a decline due to negative net outward migration. Birth data allow the analysis of annual records in a permanent population without providing any indication of the meaning of these records in terms of the degree to which actual generations succeed one another over time. There are methods by which births in calendar years can be selected and ordered by mother’s year of birth and thus determine birth rates by age within generations. The requirement, however, is to collect data on births per female generation for 35 calendar years to quantify the formation of all offspring generation aged from 15 to 50 years. Therefore, the approach is as follows keep going. Such data have been collected, processed, and organized by the author for all years since the 1966 census, and some of the results will be presented in the Appendix. The priority in this article is given to the census data, this large-scale statistical operation. Population censuses provide a valuable single picture of the number of children born to all women in the country before the date of surgery. We would like to remind you that the census questionnaire includes a sign for female persons aged 12 and over Number of children born alive. Census data allows analysis descent achieved on the date of operation by women’s ages and generations. This is an approach RETROSPECTIVE. There is a descent for women aged 15 to 50 partial, has reached a certain age, and for women aged 50 and older there is only one descent last. It should be remembered that these data refer to women living at the census date, not to the original population of the generation. Ancestry data obtained on the date of the census, however, retain their exceptional value.
In the average number of children born to a woman from the population of the country during the census, you can read part of the population’s demographic past and outline part of its demographic future.
2. Data
The first final figures for the 2021 census, released recently by the National Institute for Statistics, have some tables of the female resident population by number of live births by age, marital status and education level. This is cumulative information on the demographic events of births, live births, life expectancy for women until December 1, 2021, in the approach longitudinal, for generations. Only at the generational level can we see the true course of the population over time and estimate future development. We can obtain this information from annual birth statistics only to a small extent and with limited comparability. Annual dates are sequences of formation final descent generations, the number of children born at the age of 50.
The article examines the average number of children born by age and generation of mothers and compares them according to two characteristics of a woman – marital status and level of education.
3. Mothers and children, childless women. Review
In Figures 1A, 1B and 1C and 2A, 2B and 2C, we see the overall picture of mothers and their children in the December 1, 2021 census. The data refer only to the female population who have given birth to children. The data, released by the National Institute for Statistics, covers the female population aged 11 and over, which is 8.7 million, with 66 percent of those with children and 34 percent of those born without children. This study considered only the female population aged 15 and over out of 8.3 million, the two proportions being 69 and 31 percent.
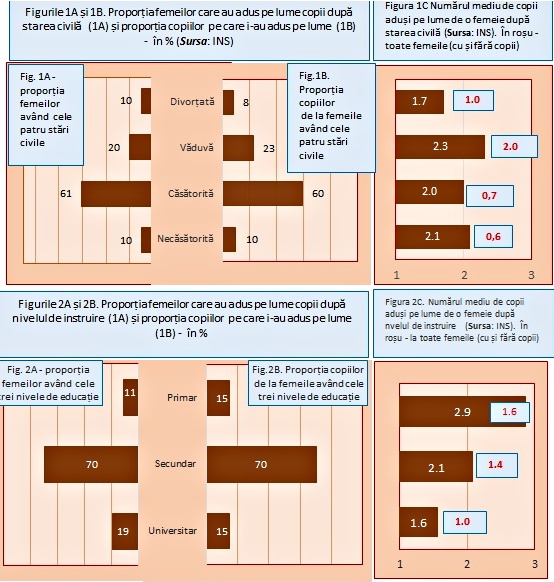
Why are we talking about the big picture? Because the figures contain aggregated data at the level of four marital statuses and three levels of education, hiding large variations in the average number of children born to a woman by age and generation.
3.1. Peculiarities of a woman’s marital status
The largest share of the population aged 15 and over with children is occupied by married women – 61 percent, widows – 20 percent, unmarried and divorced women – 10 percent each (Figs. 1A, 1B). There is some consistency with these proportions of children born to the four categories of women, whose values are, respectively, 60 percent, 23 percent, 10 percent, and 8 percent. The average number of children born is 2.3 for widowed women (Figure 1C), they are mostly elderly and thus come from past family patterns that were much more favorable to families with children. Unsurprisingly, unmarried women with 2.1 children come next, followed by married women with 2 children.
It is appropriate to draw a conclusion about this situation. In the tables of the final data published so far, we have no other information about unmarried women, such as the prevalence of marriage unions, ethnic and religious affiliation, characteristics that could provide some explanation. However, it should be noted that the value of 2.1 children per woman is observed among unmarried women, who constitute only 24 percent of the total unmarried female population, which is significantly higher than the share of married women with children (84 percent). Finally, divorced women have an average of 1.7 children.
The value of the indicator for the entire female population aged 15 years and older, with and without children, is in the same order of 2 children for widowed women and far from the level of replacement of generations over time for unmarried, married and divorced women. , with 0.6, 1.7 and 1 child.
Two main findings can be noted: (i) – the average number of children at the census date is at the generational replacement level only for all widowed women, with and without children, and is determined by women with primary and secondary education who are over 55 and (ii) – more importantly, the rate is less than 2 children for all women with other marital status and for all women with or without schooling, and at the level of the entire female population aged 15 and over is only 1.4 children per woman, which far from the level claimed by replacing generations over time and ensuring a stable population over time.
3.2. Features according to the level of education of women
Mothers with secondary education (secondary, vocational, vocational, and gymnasium) clearly dominate in equal proportions both in the total number of mothers and in the total number of children born – 70 percent (Figures 2A and 2B). This is an expression of the modest level of education of the Romanian population. Mothers with higher education (without non-university higher education) make up 19 percent, and mothers with primary education make up 11 percent (come from the older generation). The birth proportions of these women do not follow this hierarchy, being equal, 15 percent. However, these equal proportions correspond to a significantly lower average number of children for mothers with tertiary education, 1.6 compared to 2.9 for women with primary education (Figure 2C). Increasing female education has always been a major factor in the decline of female fertility over time in all societies.
It is noteworthy that women who gave birth to children with primary education and those with secondary education provided a generational change of 2.9 and 2.1 children per woman. Even mothers with higher education have only 1.6 children per mother. These values of the three indicators in Figure 1C can be extended to the entire female population aged 15 years and older, thus also including women who have not given birth to children, and the picture of the expected evolution of the entire population over time is different. This difference represents the non-interchange of generations over time and the context of the decline of the entire population (numbers in red): 1.6 children and 1.4 children for mothers with primary and secondary education and only 1 child for those with higher education.
4. Having and not having children. How age, marital status and level of education affect.
The presence or absence of children at the census date depends on many factors, age, marital status, level of education, strength of cultural, ethnic and religious patterns, health status of the woman, the couple and the frequency of infertility. [1],[2], about the degree of alternative family/couple forms that are unfavorable for the birth of a child, about the extent to which the realization of women still occurs today through pregnancy, motherhood, child birth (an outstanding educator from the USA stated not so long ago that the realization of women today occurs through kar ‘era and travel). What sums up the effect of these factors on the European population over time, especially since the 1970s, is the decline in the average number of children born to women.
Census data from December 2021 allows an analysis of female fertility by marital status and education level by age, and the following figures provide detailed data. There is a lot of data, but the graphical formula makes it easier to study.
Figures 3.1, 3.2, 3.3. and 3.4. the structure of women over the age of 15 who have and do not have children, by marital status, by age group is given. The structure is similar for married and widowed (ex-married) women and has specifics for single and divorced women. 84 and 86 percent of women in the first two groups have children. By age group, the share exceeds 80 percent after the age of 35 and reaches values of 89-92 percent at the age of 55-74, moderately higher among widowed women. Only 29 percent of unmarried women over the age of 15 have children. Some of them are teenagers and young adults and will fall into the group of married women with and without children. Unmarried women with children are recognized as part of consensual unions, which are to a lesser extent declared in the census
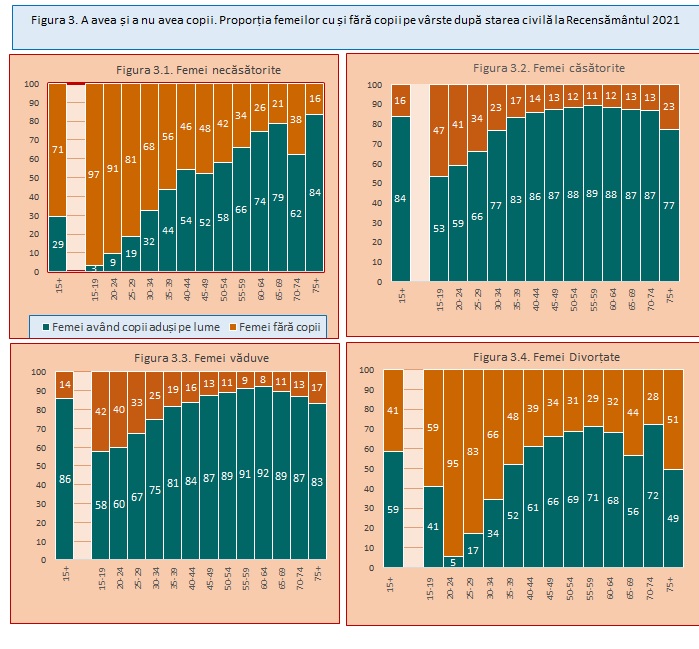
It is appropriate to make an observation about this situation. In the tables of the final data published so far, we have no other information about unmarried women, such as the prevalence of marriage unions, ethnic and religious affiliation, characteristics that could provide an explanation. However, it should be noted that the value of 2.1 children per woman occurs in the unmarried female part of the population that has children, only in the already mentioned proportion – 29 percent, which is far from the proportion of married women with children – 84 percent. Divorced women give birth to 59 percent of children, in some age groups the share reaches 60-70 percent.
Marriage was and still is the cradle of the child both for widowed women and to some extent for divorced women. If among young unmarried women there is a high proportion of those who do not have children, this is normal, they have a future ahead of them, then among divorced women aged 35 and older with a high proportion of childless people, we can talk about the years that have passed and are not coming back. – Read the rest of the article and comment on Contributors.ro
Source: Hot News
Ashley Bailey is a talented author and journalist known for her writing on trending topics. Currently working at 247 news reel, she brings readers fresh perspectives on current issues. With her well-researched and thought-provoking articles, she captures the zeitgeist and stays ahead of the latest trends. Ashley’s writing is a must-read for anyone interested in staying up-to-date with the latest developments.