
Comparisons between cities often appear in the press: where is it better to live, in Cluj or in Bucharest? In Timisoara or Iasi? The answer is more complicated because you have to look at several indicators. The World Bank uses gross national income per capita (the atlas method), but there are other methods.
The World Bank estimated gross local income per capita for each settlement in Romania using a large and detailed economic database provided by the National Institute of Statistics. The figure below shows the classification of Romanian settlements according to this methodology.
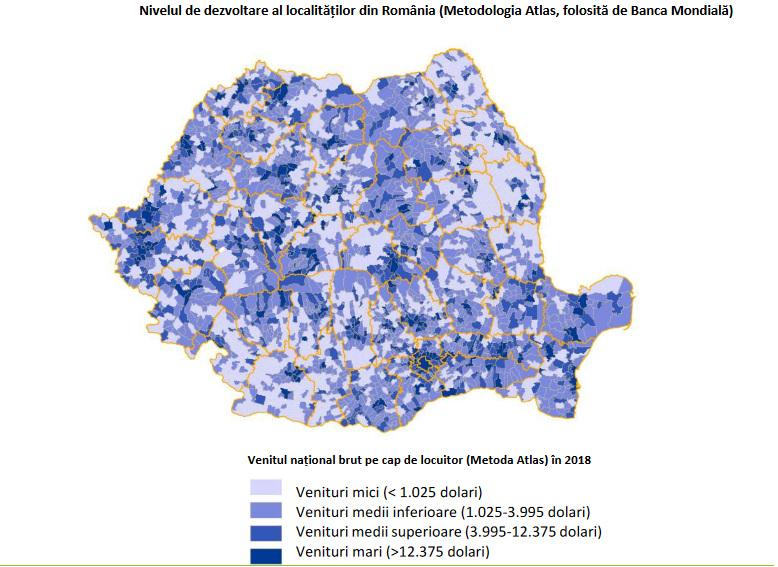
If we analyze only the data by cities, we can see that out of 319 municipalities and small cities in Romania, 9 have a low income level (especially small cities with a population of less than 10,000), 89 have a below average income level (most with a population of less than 20,000) , and 153 are upper-middle income (most with a population of less than 50,000). Of the 68 high-income localities, most were large cities or parts of a large functional urban area.
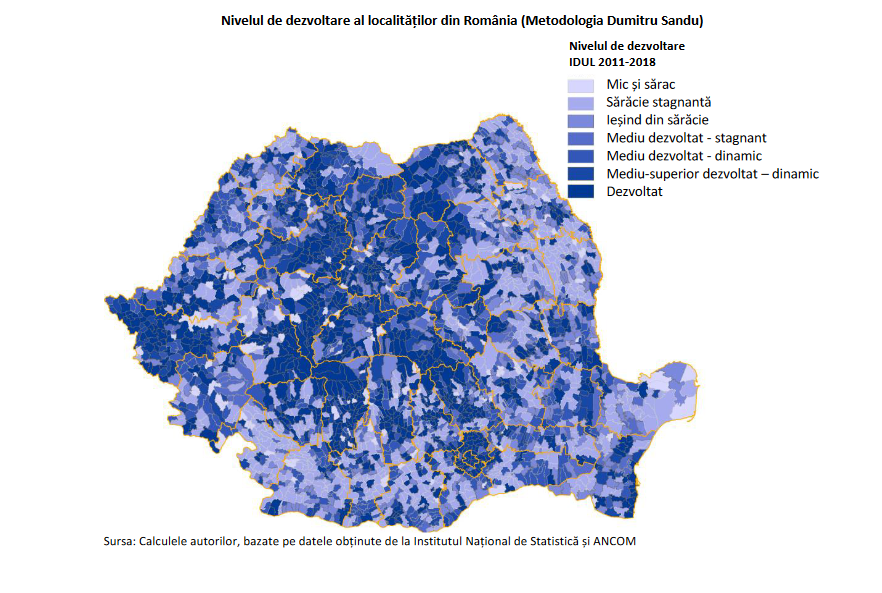
The UN refers to the Human Development Index (HDI). The SIN methodology was adapted at the local level by Professor Dumitru Sandu. In a report prepared for the authorities, he calculated the index of local human development for all settlements in Romania
The methodology classifies settlements into poor, medium-low developed, medium-highly developed and developed. The figure below shows a dynamic classification that also analyzes how a particular area has evolved over time (in this case from 2011 to 2018) – so it’s not just a static metric.
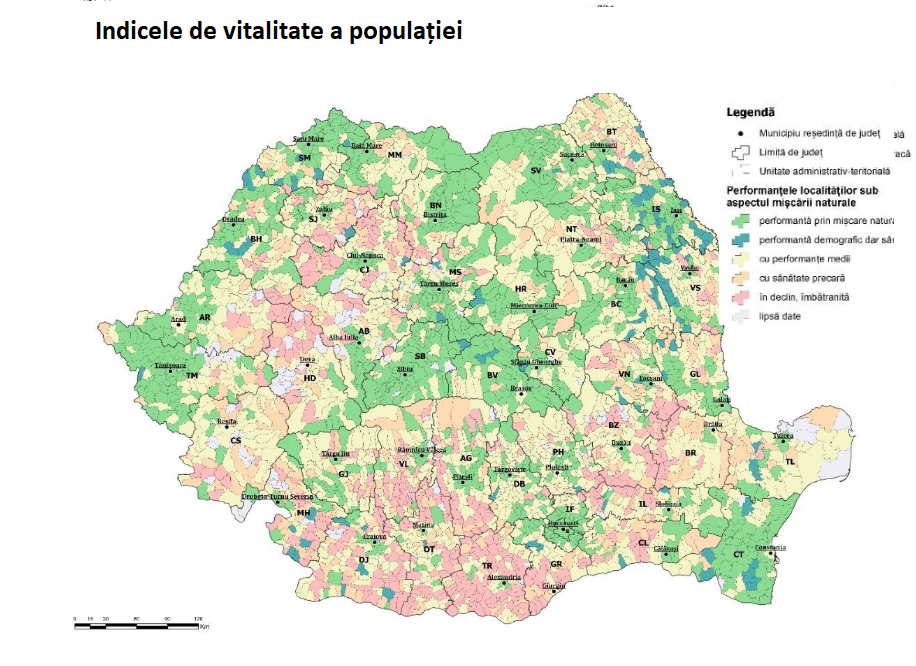
In the context of overall population decline, demographics are another key dimension that can be used to assess the performance of an area. The new methodology, developed by Professor Dumitru Sandu, concerns the assessment of the “vitality of the population” of the area.
Vitality index of the population takes into account several sub-indicators: the aging index (the population over 65 divided by the population under 14); ratio of elderly dependents (population over 65 divided by population aged 14 to 65); natural increase rate (birth rate minus death rate divided by the total population); infant mortality rate. The figure below shows the population viability index for each settlement in Romania (with a few exceptions where data were missing). Areas shown in green generally had positive demographic indicators by Romanian standards, while those in red had negative indicators; yellow areas had average performance.
But when we compare cities or towns, we must also look at other aspects:
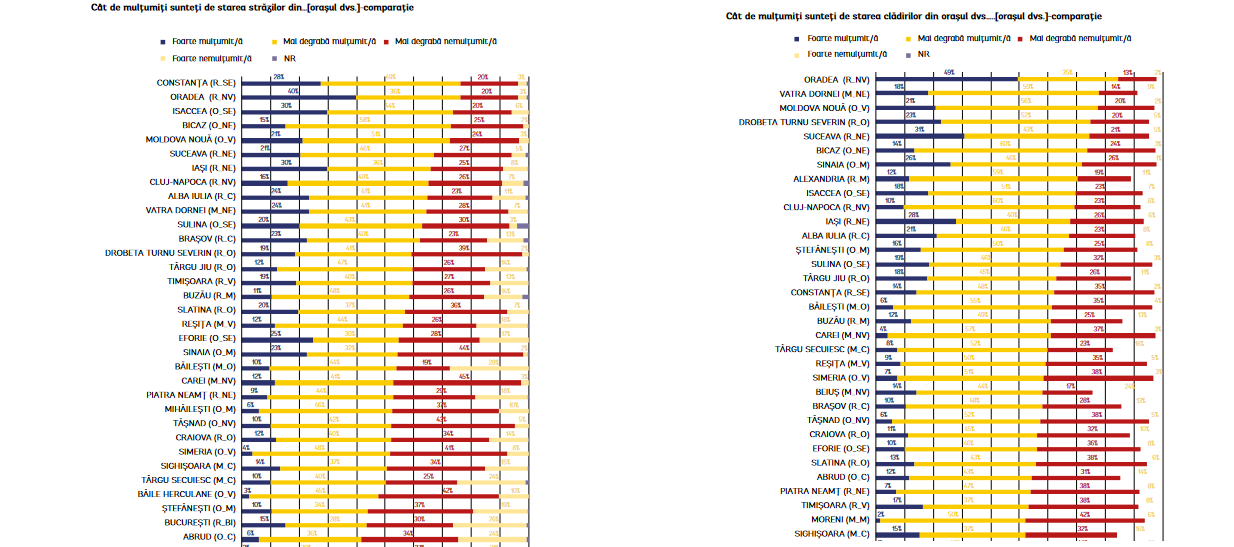
How residents perceive the noise level in their locality
Noise level is a significant urban stressor. A little more than half of the urban population (57%) declare that they are satisfied with the level of noise in the city where they live.
As with air quality, there is an increase in satisfaction in small cities compared to large ones: 49% on average in settlements with more than 100,000 inhabitants, respectively 68% on average in settlements with less than 20,000 inhabitants. In county residences, the average figure is 54%, in non-resident municipalities 66%, and in non-municipal cities – 71%.
As a rule, middle-aged people (25-54 years old), active, with an above-average education, with a personal income of more than 4,000 lei/month and dependent children are much more dissatisfied with the noise quality than the average population.
Comparative data for the last five years for the “witness” cities show that outside the Bucharest-Ilfov region, which ranks last in the noise satisfaction hierarchy, Sud-Muntenia also registers below average values (54%) for the presence of Ploiesti in the lower segment of the hierarchy.
Above-average satisfaction was recorded in all other regions, with the North-East region ranking first with a satisfaction level of 75% of the total population.
In the nine cities where the inflation rate exceeds 80%, there are two municipalities of residence: Suceava (85%) and Piatra Neamts (81%). Bucharest (33%) and Ploiesti (29%) register rate increases below 40%.
How residents perceive air quality in their locality
60% of the urban population of Romania are satisfied with the air quality in their cities of residence.
The highest degree of satisfaction with air quality was recorded in the Northeast and Southeast regions (75%), and the lowest in the Bucharest-Ilfov region (34%).
Satisfaction with air quality increases with decreasing population size, from 34% in Bucharest to 71% in cities with less than 10,000 inhabitants.
Although only six of the 17 district residences are positioned below the national average, the high degree of dissatisfaction measured in Bucharest and Ploiesti changes the overall average of the district residences by 10% of the total. Thus, at the national city level, the average satisfaction recorded in county seats is 54%, in other municipalities 68%, and in other cities 70%.
People aged 25-44, parents, especially mothers, people with above-average education, entrepreneurs (employers or self-employed specialists), with individual incomes are more dissatisfied with air quality, compared to the average population over 4,000 lei/month
How residents perceive green spaces, parks and gardens in their locality
Nationally, 66% of respondents said they are satisfied with green spaces, such as parks and gardens, in the cities where they live.
The highest level of satisfaction with the quality of green spaces was recorded in the Southeast region (71%), and the lowest in South Muntenia (49%).
In four municipalities of residence, the level of satisfaction exceeds 80%: Oradea (80%), Drobeta-Turnu-Severin (81%), Cluj-Napoca (82%) and Iasi (82%); Alexandria is a residence that registers values below 40% (respectively 38% satisfaction).
People satisfied with the quality of space they see are more likely to live in cities with a population of 100,000 to 500,000 (satisfaction average 75%) than in cities with a population of less than 30,000 (satisfaction 54%); . Residents of district residences are significantly more satisfied (68%) than residents of the district
non-municipal cities (54%). Middle-aged people aged 35-44 who have small dependent children are much more dissatisfied than young people (18-24 years old) and people without children.
People with lower education are less satisfied with the quality of green spaces (58%) than people with higher education (68%).
Satisfaction with the quality of green spaces increases with income, from 64% for those with a personal income of less than 2,000 lei/month to 71% for those with a personal income of more than 5,000 lei/month.
How residents perceive the cleanliness of their locality
The share of those who say they are satisfied with the cleanliness of the city they live in is 57%. The degree of satisfaction is lower in small cities with a population of up to 50,000 inhabitants (49% on average) and Bucharest (46%).
People aged 25-44, active, from families with minor children and average or lower incomes are more dissatisfied with the quality of cleanliness (compared to the average indicator).
Three localities register satisfaction values above 80%: Sinaia (88%), Suceava (84%) and Bikaz (81%). Five counties, including Bucharest, have a lower level of satisfaction measured at the national level. Below 40% satisfaction was recorded in seven settlements, Ploiesti being the only place of residence in the last place (16% overall satisfaction).
At the regional level, Sud-Muntenia ranks last in terms of satisfaction with urban cleanliness (42%), followed by Bucharest-Ilfov (46%). The highest percentage of satisfaction was recorded in the Southeast (71%), in all other regions the overall satisfaction rate was 63%.
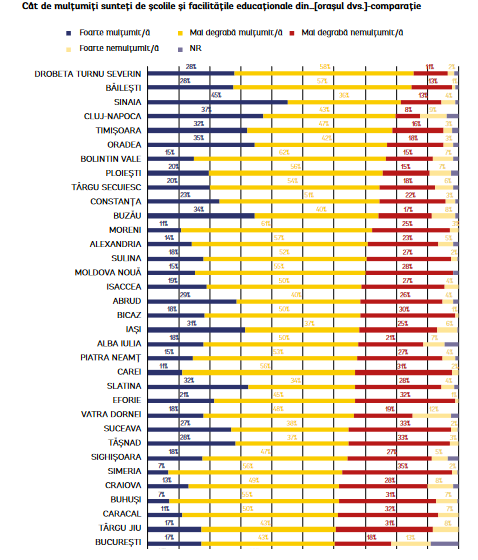
How people perceive the quality of schools in their region
About two-thirds of the urban population (67%) declare a high level of satisfaction with the schools and educational institutions that they have access to in their place of residence.
In three regions, the satisfaction level exceeds 70%: South-East (72%), North-West (71%) and South-West Oltenia (70%). In the Bucharest-Ilfov region, the degree of satisfaction is the lowest (60%). Satisfaction is generally higher in cities with a population of 100,000 to 500,000 (73% on average) and lower in cities with a population of 30,000 or less (62%). The stability and quality of human resources in education may be possible explanations for this difference.
In the district settlements, the share of satisfied people is on average 5% higher than in other cities. Satisfaction tends to decrease with age, with young people (18-24) showing significantly higher levels of satisfaction (71%) than people over 65 (63%).
The assessment of the quality of educational services is higher among people with secondary education, vocational schools – 69% and weaker at the extreme points of the distribution: people with primary education – 62% of the assessment, people with higher education – 63% of the assessment.
The highest level of assessment was recorded among students (69%) and private sector workers (68%), and the lowest among inactive people (62%). People with an individual income of 2,001 to 4,000 lei reported a higher level of price inflation than the average (72%).
Respondents who do not have dependent minors (youth, pupils, students) are generally more satisfied than those who are parents of children in school.
In three cities, the share of satisfaction with educational services exceeds 80%: Drobeta-Turnu-Severin (86%), Beileşti (85%) and Sinaia (82%), the last two are atypical for the category to which they belong (centers). medium urban areas except county seats) taking into account the specific local context. At the opposite pole of the hierarchy, there are three urban settlements that have accumulated a share of satisfaction below 50%: Karansebesh, Štefanesht and Mykhailosht.
Data source: World Bank, INS, Eurostat, UN
Source: Hot News
Mary Robinson is a renowned journalist in the field of Automobile. She currently works as a writer at 247 news reel. With a keen eye for detail and a passion for all things Automotive, Mary’s writing provides readers with in-depth analysis and unique perspectives on the latest developments in the field.